In Linux, the Load Average is an important metric used to monitor system performance and resource usage. It helps us understand how busy the system is and whether it’s managing processes efficiently. In this guide, we’ll provide a clear overview of what Load Average means in Linux and show how we can easily check it using different commands.
Table of contents
What is Load Average in Linux
In Linux, the Load Average shows how busy the CPU has been over a certain period. It reflects the average count of processes currently active or queued for CPU execution. This gives a clear idea of how effectively the system is managing jobs/tasks. Linux shows the Load Average as three decimal values, for example: load average: 0.07, 0.02, 0.01 represent the system’s average load during the past 1, 5, and 15 minutes, respectively.
These values help users track short-term and long-term CPU activity. For example, a load value of 1.0 means full CPU usage on a single-core system. On multi-core systems, the same load would be divided across cores. A load of 1.0 on a dual-core CPU equals about 50% usage, and on a quad-core CPU, around 25%.
The Load Average includes both running and waiting processes, showing an average rather than a real-time snapshot. While it doesn’t directly show CPU usage in percentages, comparing the load value to the number of CPU cores provides a good estimate of system performance and resource utilization.

HostOnce’s Shared Hosting offers fast, secure, and scalable NVMe SSD hosting with easy customization, strong uptime, and great value.
Checking the Load Average in Linux
Several commands can display Load average information, but the most common ones are uptime, top, and glances. Each provides a slightly different view of your system’s performance.
Monitor Load Average Using the uptime Command
The uptime command is the quickest way to check the Load Average. It displays the system’s uptime, the number of active users, and the average CPU load from the last 1, 5, and 15 minutes.
To check the load average, open your terminal and run the uptime command like this:
uptime
Here, the system is up/running for 9 minutes, with one active user. The load averages show CPU usage trends of 0.07 for the last minute, 0.07 for the last 5 minutes, and 0.06 for the last 15 minutes.
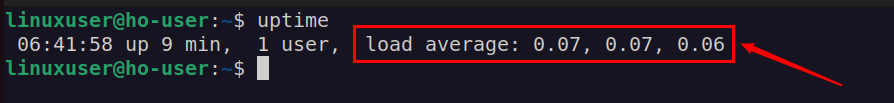
This command gives a quick glance at overall system performance.
Check Average Load Using the top Command
The top command gives a live and detailed overview of the system’s resource consumption, showing information about CPU, memory, and active processes. It’s more comprehensive than uptime and is commonly used for performance monitoring.
To use it, type tpp in your terminal and hit the ENTER key:
top
Once executed, you’ll see a continuously updating interface showing system activity. The Load Average values appear on the first line of the output, just like this:
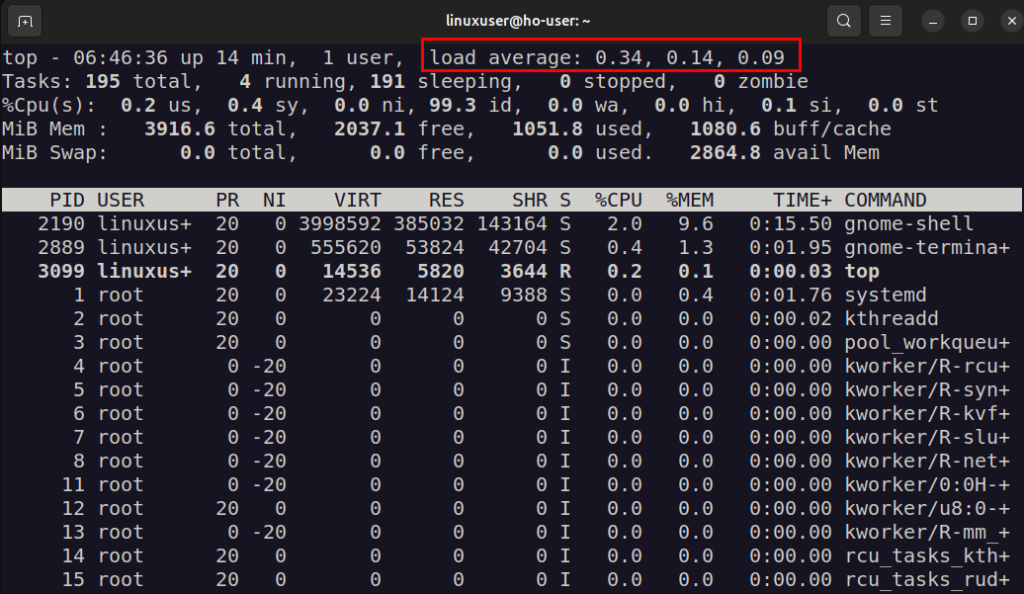
These numbers represent the same time intervals (1, 5, and 15 minutes) as before. Along with displaying the Load Average, it indicates which processes are utilizing the highest amount of CPU or memory, making it easier to track and diagnose performance issues.
Check Load Average Using the glances Tool
Glances is a useful resource monitoring tool that offers a more detailed and user-friendly view of system performance. It displays information about CPU, disk, memory, network activity, and Load Average in a single view. To install it, use the default package manager:
sudo apt install glances

Now you can launch it easily using the following command:
glances
This opens a live monitoring dashboard directly in your terminal. Unlike the top command, Glances also displays the total number of CPU cores, which helps you better interpret the Load Average values.
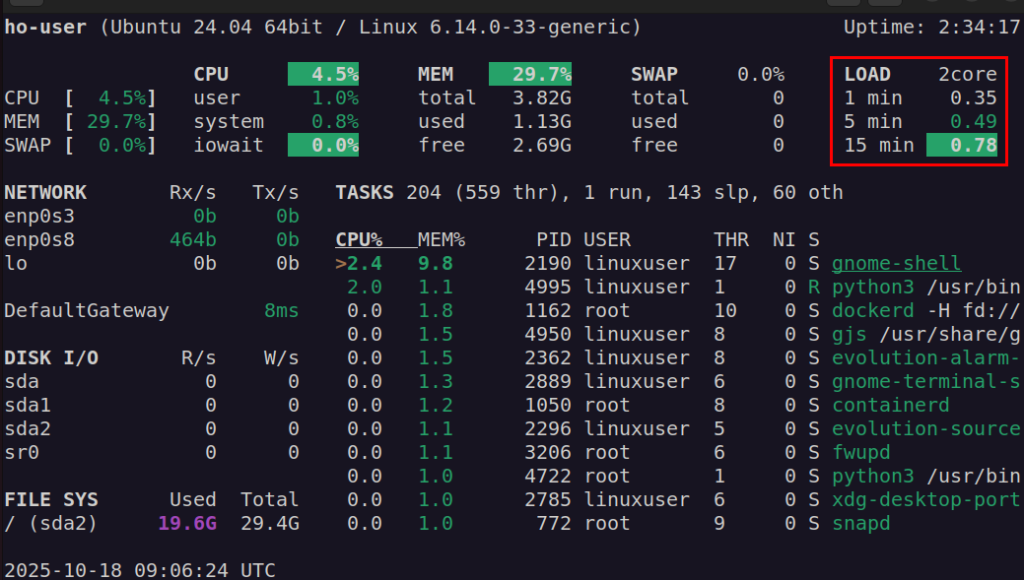
The visual layout and additional details make Glances especially useful for continuous system monitoring.
Conclusion
Load Average gives a clear picture of how efficiently the system is managing processes over time. For this purpose, Linux offers different commands such as uptime, top, and glances. We can use these commands to easily identify if the system is running smoothly or struggling with a high load. Each command offers a different level of detail, from a quick overview to real-time and comprehensive monitoring. In this write-up, we discussed all these commands to maintain optimal system performance and quickly address any potential performance issues.
FAQ
Which command is best for checking Load Average?
You can use any of the three: uptime, top, or glances. Use uptime for a quick check, top for real-time monitoring, and glances for a detailed overview.
Does a high Load Average always mean a problem?
Not necessarily. A temporarily high Load Average can occur during heavy processing tasks. It becomes an issue only if it stays consistently higher than your CPU core count.
Can the Load Average be checked on all Linux distributions?
Yes, commands like uptime and top are available on almost all Linux distributions, while glances can be easily installed if not preinstalled.
How can I reduce a high load average?
You can lower the load by closing unnecessary applications, stopping unused services, or optimizing processes that consume excessive CPU resources.