Frustrating to experience downtime or slow loading times on your website. Performance issues occur when resources exceed limits. We know and have overcome this feeling. This is why we have decided to provide you with instructions that help you identify the causes of website overload cPanel.
Table of contents
Key Takeaways
- Website Overload on cPanel is bad for your site’s condition
- Resource Monitoring of cPanel reduces overload
- Reducing website overload is essential for the best performance
Causes of Website Overload on cPanel
Multiple ways can be chosen to fix an overloaded website. cPanel is the first choice for many. The procedure is as simple as they come:
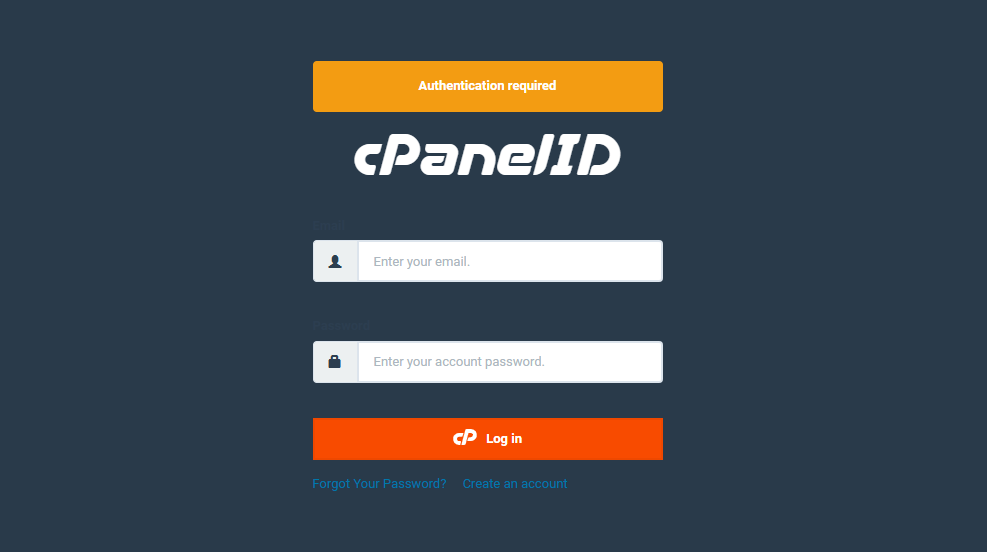
1. Log in to cPanel
You have the right credentials, right? This is the time to use them.
2. Monitor Resource Usage
You can find the Resource Usage tool on the cPanel dashboard. Get it under the METRICS tab.
3. Observe Resource Usage Status
It is good news if no problems are identified. Your website functions well with the allowed resources.
The situation can go polar opposite when the dashboard shows your site was limited at some point in the last 24 hours. Resource limits exceeded in that duration.

Skip overload issues for good with Hostonce!
Avoid slowdowns before they happen, as now is the time to make a smart choice of selecting Hostonce’s optimized hosting.
4. Analyze Website Overload cPanel
The cPanel resource usage dashboard aids you well by showing the current status for resources like memory, CPU, and input/output. You can see where usage is high. The key resources that impact your site performance are:
- Memory: Tracks how much RAM your site needs to run.
- CPU: Displays the amount of processing power your website uses.
- Inodes: Counts the folders and the files in your account.
- Input/Output: Measures the data transfer speed between your server and site.
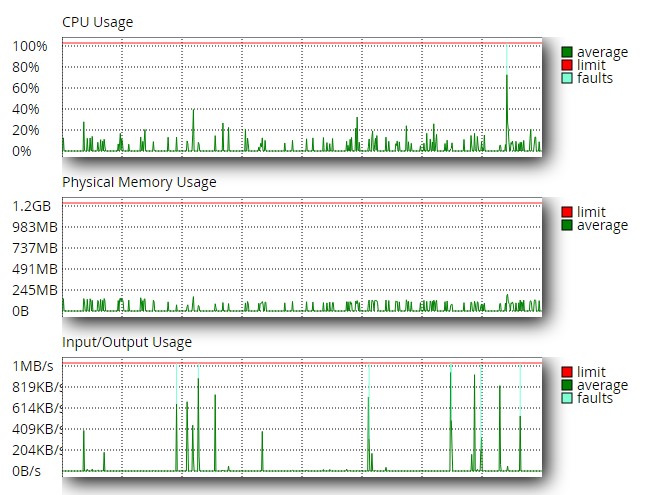
All of this helps you check website load cPanel.
5. Customize Units and Timeframes
Customization options are around to adjust the given units and timeframes. It supports you to focus on moments when resource usage is high. The graph is set to display the hourly status to show resource usage.
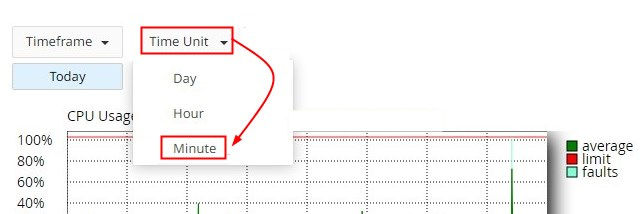
Click the Timeframe and Time Unit menu to change this. Use a different option and treat yourself by changing the time to minutes.
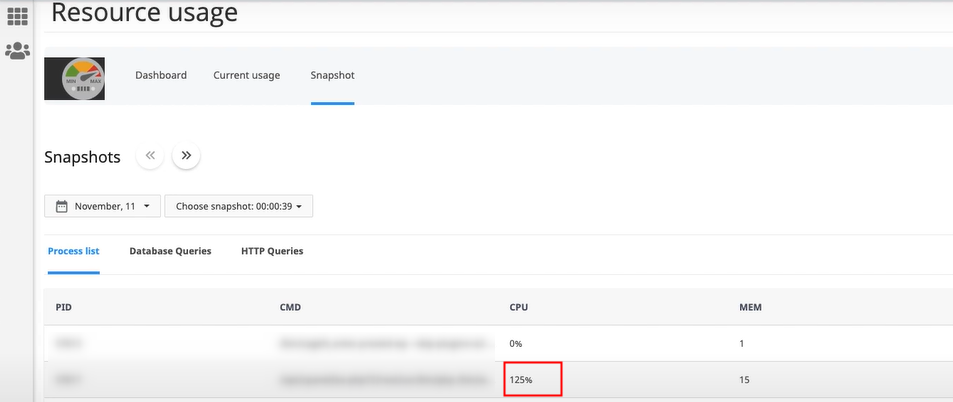
6. Snapshots for Analysis
The snapshot tab shows you detailed snapshots of site activity at particular times. Snapshots offer insight into processes that consume a lot of resources. The central details of the snapshots are:
- A process ID shows a specific number for every process.
- The command (CMD) displays the command or script being run.
- CPU usage shows how much CPU a process consumes.
cPanel CPU usage must be looked into. Examine processes that use too much memory or CPU. They might need optimization if they are causing the overload. The following screenshot can show you the exact culprit of overloading:
7. Check HTTP Queries and Database
Running queries can be seen in the Database Queries tab. Frequent or long-running ones may show inefficiencies that need fixing. The HTTP Queries tab lists show requests to your site: large files or high traffic drain resources.
Identify or address repeated and slow queries to reduce the load on the server.
cPanel Resource Monitoring Weighs Beyond Imagination
Do you know what the worst possible time for website overload in cPanel is? It is when visitors are active and pages slow down. Your website feels unresponsive and leaves a bad impression. Understanding the Resource Usage panel is not just a technical task; it is a crucial part of a healthy online presence.
Open the dashboard and look at what the graphs reveal. Pay attention to how your website behaves in certain conditions. Sudden CPU spikes hint at a script running in loops or plugin conflicts, as well as increased bot traffic. Memory usage that remains high hints at a demanding theme or CMS more than your hosting is capable of.
Checking I/O carries the same significance. Maxed-out disk I/O means that pages take longer to load. This is a clear sign of the server struggling to read or write data. The key causes of overload are large file downloads or inefficient database activity along with backups triggering at the wrong moment. The HTTP Queries and the Database Queries tabs become more valuable at this stage. They expose all faulty operations that drain the server power.
Check these sections in cPanel on a daily basis. This is how you detect performances beforehand and optimize scripts as you clean up unused files. You can adjust hosting resources before overload becomes too repetitive to deal with.
Seek Hostonce guidance in similar matters. Disappointment will become a stranger to you with the support of our expert team.
Conclusion
Website overload cPanel will be easy to diagnose if you have an idea of what to look for. Resource usage and HTTP query monitoring make a full picture of what affects your performance. Consistent checks and proper optimization with reliable hosting make your website stable and responsive.
Hostonce is here to help if you want hosting for handling resource spikes with ease.
Frequently Asked Questions
What causes website overload cPanel?
High traffic and heavy scripts are the main culprits. Too many plugins and large files contribute a lot. Slow queries or insufficient hosting resources are not behind either in terms of overload issues.
What are inodes in cPanel?
Inodes count the total files and folders in your hosting account. Too many inodes can lead to overload or storage issues.
How do snapshots help in diagnosing overload?
Snapshots show which processes were running at a specific time and how much CPU or memory they used. They help you find the exact culprit.
Can hosting affect how often my site overloads?
Yes. Limited resources and outdated servers or hosting of low quality increase overload frequency. Upgrading to a better host like Hostonce reduces these issues a lot.