

Just like every software, the WordPress website also has its fair share of glitches and errors. For example, 60% of WordPress sites encounter WP debug issues that can lead to a plugin conflict or the dreaded white screen of death. With WordPress controlling more than 500 million websites today, these problems have led to over 200,000 installations of a WordPress plugin like Query Monitor for debugging and troubleshooting.
Whether you’re a developer or a website owner, understanding the WP Debug Guide process is a must. This article will show you how to debug your WordPress, the importance of using debugging plugins for WordPress, and common errors when enabling WordPress debugging. We will also look at terms like WordPress debug log, WordPress configuration file, WordPress admin bar, and many debugging plugins. When it comes to WordPress development, understanding specific debugging areas can save you time, money, and effort.

What Is WordPress CLI (And How Can You Use It)?
By Festus Nkopuruk on May 16, 2026Key Takeaways
- Debugging a live site is vital because it exposes PHP code errors, WordPress database problems, and plugin conflicts that can affect the performance of your website.
- WordPress debug mode and logging errors are necessary for discovering the right information that can lead to accurate troubleshooting from the directory of your WordPress installation.
- WordPress comes with plugins like Query Monitor and Transients Manager to help enable the WordPress debug mode without using any line of code.
- Whether you’re debugging JavaScript or CSS code, it is essential to update your plugins and themes to reduce the chances of having any problems with WordPress.
What is WordPress Debug Mode?
WordPress Debug Mode is a troubleshooting feature within WordPress that allows you to locate and solve any errors on your site. Since the Debug Mode is a built-in feature, it shows notices, PHP errors, and deprecated functions that are usually hidden in WordPress. The debugging settings allow web hosting users to understand how their site operates behind the scenes.
WP_DEBUG is a constant that powers the Debug Mode. In your WordPress root (wp-config.php file), you can switch wp_debug to true or disable wp-debug. After activating it in the WordPress root folder, you can boost your WordPress SEO and unlock extra tools like:
- WP_DEBUG_LOG: A tool that forces WordPress to use a log file to save errors.
- SCRIPT_DEBUG: A tool that promotes faster troubleshooting by loading unminified CSS/JS.
- WP_DEBUG_DISPLAY: For displaying errors on the WordPress admin dashboard.

Avoid common WordPress errors today!
Are you new to WordPress? Get started with a beginner-friendly hosting that simplifies debugging. Launch your first WordPress site with Hostonce’s built-in tools and easy setup.
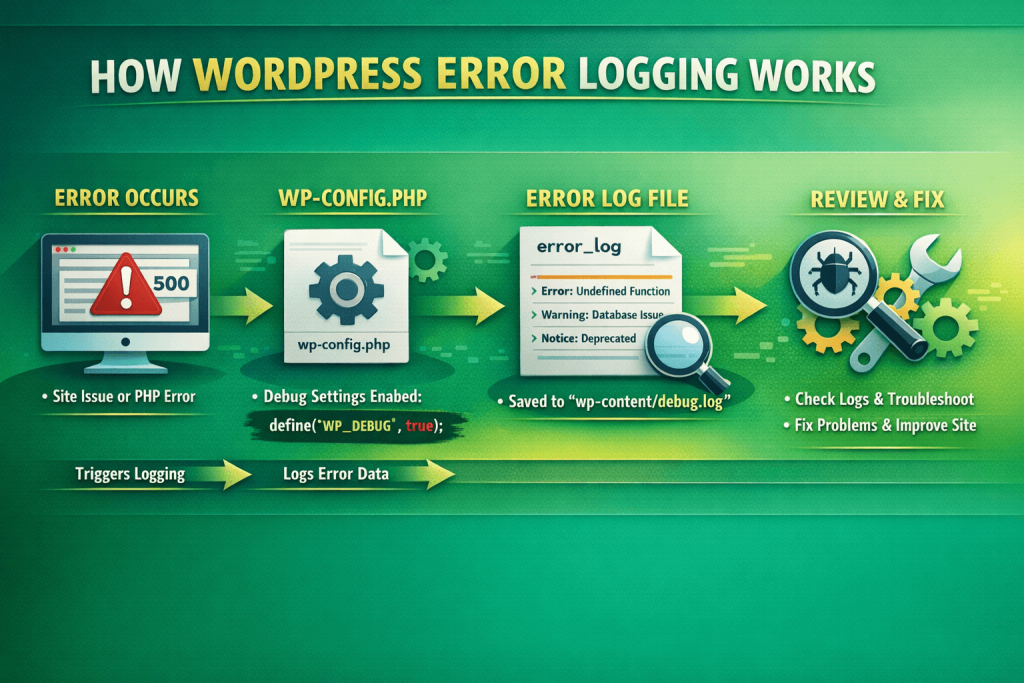
How WordPress Error Logging Works
WordPress error logging is an effective way to identify errors on your site. When enabled, every error is captured and written to a debug.log file in the wp-content directory. With this tool, you can safely perform web caching and troubleshoot without visitors seeing it. Here is what to understand about WordPress error logging:
- WP_DEBUG_LOG is used by WordPress to decide if error messages should be stored in a log file. When debugging is enabled, a file is created for storing related errors without affecting the site.
- This log file, which is stored in /wp-content/debug.log, can save errors like PHP 8.2 warnings, notices, deprecated functions, syntax errors, plugin conflicts, database problems, and so on. Remember that WordPress includes a timestamp for each file.
- Errors stay hidden from online visitors via define( ‘WP_DEBUG_DISPLAY’, false ). Keep in mind that WordPress will log them silently until you disable WP_DEBUG. This feature is perfect for live sites because it identifies the information you need to debug while maintaining professionalism during email marketing.
- You can enable logging by adding define( ‘WP_DEBUG’, true ); define( ‘WP_DEBUG_LOG’, true ); define( ;WP_DEBUG_DISPLAY’, false ) to your wp-config.php. This allows you to enable debugging, prevent users from seeing errors, and record errors privately.
How to Enable WordPress Debug Mode (WP-DEBUG)
As we have said earlier, WordPress debug tools identify unique WordPress plugin conflicts, PHP errors, and other problems that are usually hidden. If you don’t want to install a WordPress Debug Bar plugin, here is how to enable it from your domain hosting dashboard:
Step 1: Locate Your wp-config.php File
The main purpose of the wp-config.php file is to configure important features, such as debugging. This file usually lives in the root directory of your WP installation (/public_html/wp-config.php /yourdomain.com/wp-config.php). For Hostonce users, you can access it via cPanel File Manager, the hosting dashboard, or FTP/SFTP.
Step 2: Open the File and Look for the WP_DEBUG Line
After accessing the file via the WordPress hosting panel, look for [define( ‘WP_DEBUG’, false );]. If it is not there, you can add it before /* That’s all, stop editing! Happy blogging. */
Step 3: Turn on WP_DEBUG
You can activate debugging mode by changing the value of wp-debug to true. For example, define (‘WP_DEBUG’, true), and this will show different errors, conflicts, and deprecated functions affecting your domain website
Highlight
Turn on WordPress debug mode by editing your wp-config.php file and setting WP_DEBUG to true. After that, you can enable WP_DEBUG_LOG and disable WP_DEBUG_DISPLAY to safely log errors without showing them to visitors
Step 4: Enable Log-Only Debugging
Enabling log-only debugging will prevent your website from displaying errors to visitors. This feature allows you to log different errors into /wp-content/debug.log, hide sensitive WordPress data, and errors. You can do this by using define( ‘WP_DEBUG_LOG’, true ); define( ‘WP_DEBUG_DISPLAY’, false ); @ini_set( ‘display_errors’, 0 );
Step 5: Save the File and Refresh Your Website
After making changes to your wp-config.php file, you can save and reload the page. You will see a new file (debug.log) in the wp-content. After successful debugging, errors in the /wp-content/debug.log can be tracked and monitored. You can also use Query Monitor Plugin to track your website performance after debugging.
Do You Need Full Control Over Debugging?
Upgrade to VPS hosting for advanced configurations. Take full control of your WordPress environment with scalable VPS hosting and custom debugging setups.
How to Debug WordPress Without Code
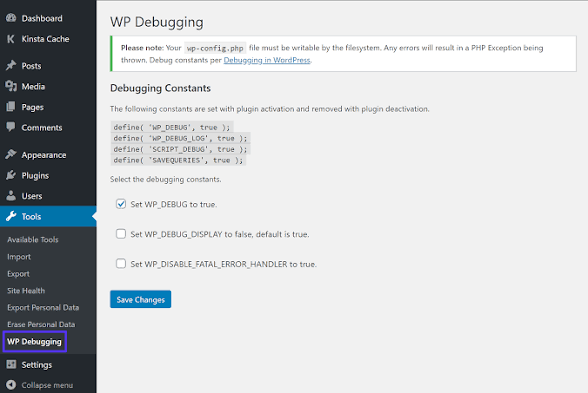
If you find the combination of wp_debug and wp-config.php overwhelming, many plugins like Debug Bar and WP Debugging can simplify the whole process for you. When you install and activate the plugin, you can debug your WordPress in one click. Here is how to debug your site without writing any code:
- Install the “WP Debugging” Plugin: This WP Debugging plugin is designed for correcting debugging constants like WP_DEBUG_LOG. WP_DEBUG, SCRIPT_DEBUG, and WP_DEBUG_DISPLAY.
- Enable Debugging: After downloading and installing the plugin, the debugging mode is activated automatically. Every error encountered on your website is shown in wp-content/debug.log, making it a wonderful option for beginners.
Common WordPress Errors You Can Fix With Debugging
WordPress Debug Mode is used to show host-level optimization problems that are affecting the speed and performance of a website. By activating the value of WP_DEBUG, you can identify and solve any errors. The following errors can be fixed with debugging:
- There Has Been a Critical Error on This Website: You get this type of error message when your site is having a fatal PHP memory error. Keeping debug mode shows the exact problem file and line number affecting the website.
- Plugin Conflicts: There can be instances where your plugin can affect your website, leading to errors like deprecated functions, PHP error logs, duplicate declarations, and undefined functions/classes. You can check the log to know the exact error from your WordPress dashboard.
- Theme Errors and Broken Templates: Thanks to debugging, you can identify WordPress theme errors and broken templates. Incorrectly named functions, missing template files, and deprecated WordPress hooks tend to be the most common error types.
- White Screen of Death (WSOD): WSOD error can be seen on a website when there is a fatal PHP error, a memory limit is reached, or an incompatible WordPress theme. Debugging can help to locate and neutralize WSOD for high-traffic websites.
- Deprecated Functions After Updates: After updating the version of your WordPress, older codes like WordPress 6.8 can activate error messages like Deprecated: Function <function_name> is deprecated since WordPress version <x.x.x.>. Debugging also enables site stability by replacing outdated functions.
Don’t Break Your Live Site!
Skip manual debugging and debug faster with hosting designed specifically for WordPress users. Let Hostonce handle performance, updates, and error tracking for your website
Best Practices for Safe WordPress Debugging
Debugging is a powerful way of fixing errors that may prevent your site from loading. To prevent mistakes during debugging, the following best practices are essential for keeping your website safe:
- Always use a staging environment like LocalWP for debugging. Website owners who subscribe to shared hosting get to enjoy premium staging tools from popular hosting providers.
- Use relevant debug information on your site. Permanently activating WP_DEBUG can expose your site and database details to hacking
- Do not show errors on-screen on live websites. You can use Debug Log to keep these errors hidden from people who visit your site.
- Avoid editing any code via the WordPress editor. You can use SFTP, a testnet, or version control to prevent breaches while fixing your site
- After fixing the error, always clear your cache to prevent your website from hiding real-time changes.
Expert Tip
When debugging complex issues, enable WP_DEBUG_LOG and pair it with a tool like Query Monitor to trace errors back to the exact plugin, theme, or function causing the problem. This saves time compared to guessing or disabling plugins one by one.
Final Thoughts on WP Debugging
WordPress debugging is an essential skillset for every website owner because it is perfect for detecting DDoS attacks and fixing any errors immediately. If you do not know coding, you can use a plugin like Query Monitor for fast troubleshooting. With WordPress controlling 43% of all websites, debugging is the best way to protect your site and keep it running. Furthermore, you can also use WordPress security plugins for extra security against any form of threat. If you have any questions or need assistance debugging your website, you can contact us on Twitter (X) to speak with a professional.
FAQs
How do I enable WP_DEBUG on my WordPress site?
You can enable WP_DEBUG by editing the wp-config.php file and adding define(‘WP_DEBUG’, true);. For beginners, plugins like WP Debugging or hosting dashboards can activate it without code.
What are the benefits of using WP_DEBUG?
Using WP_DEBUG helps you identify plugin conflicts, theme errors, PHP notices, and database issues. It also allows you to log errors safely without displaying them to visitors.
Can I enable debugging without editing code?
Yes! You can use WordPress plugins like WP Debugging or Query Monitor, or enable debug mode directly from your hosting dashboard (e.g., Hostonce) to view logs safely.
How do I safely disable debug mode after troubleshooting?
After fixing issues, turn off debugging by setting WP_DEBUG to false in wp-config.php, and disable any debug plugins. This prevents sensitive error information from being exposed.
Working with Properties and Key-Value Pairs in Theme.json
By Festus Nkopuruk on August 7, 2025
Hostonce is the #1 WordPress Host
Ranked by 930+ customers in G2's Best Software Awards.